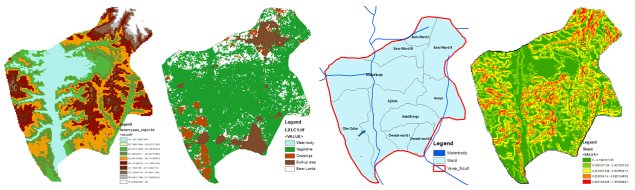
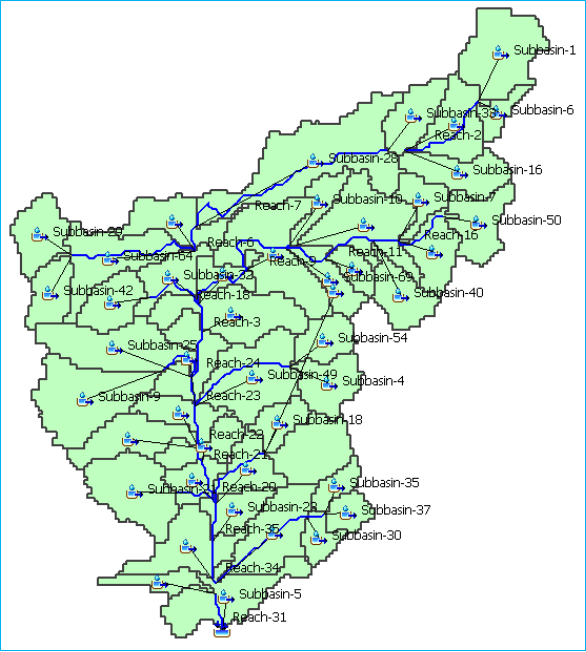
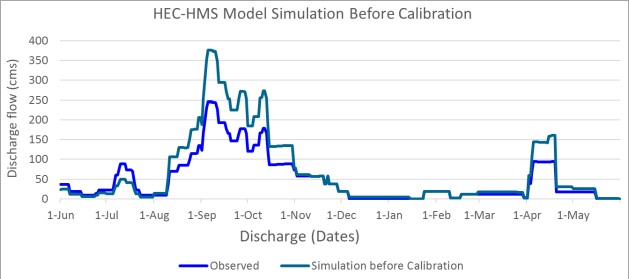
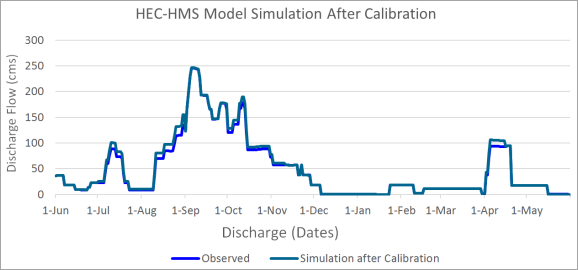
In the bid to accomplish the Sustainable Development Goals, several attempts have been made in Yewa South LGA to accomplish environmental sustainability (SDG7) and reduce the adverse effects of climate change (SDG13). The area has witnessed recurrent flash floods with deleterious effect to lives and properties due to anthropogenic factors coupled with incessant torrential rainfall events which are the major drivers of flood vulnerability in the area. Previous studies have adopted the use of GIS, Remote sensing or an integration both techniques with associated challenges. This study adopts the use of Hydrologic Engineering Centre’s Hydrologic Modelling System with Geographic Information Systems (HEC-GeoHMS) to evaluate the relationship between rainfalls, terrain characteristics, run off and stream flow as an alternative flood mitigation scheme. The catchment area was divided into forty-five sub basins over a 10m DEM, the run off hydrographs simulated and the hydrological characteristics modelled by using rainfall data between 1st June, 2022 – 31st May, 2023 as well as discharge data from Ogun-Osun River basin Development Authority (O-ORBDA). the model parameters were optimized for calibration and the calibrated model was thereafter validated using three statistical evaluation criteria which showed that there is a good simulation between the observed and estimated values (Rep = -2.24%, REv = 6.67%, NSE = 95.03%, and R2 = 0.83). Further analysis of the results showed that the flash flood is induced mainly by hydrologic characteristics of the area. This work therefore proposes to mitigate flood in Yewa South Local Government Area of Ogun State by modelling how excess water runs on the terrain thereby creating flash floods. The model will serve as an input for putting mitigation measures in place to arrest flash floods.
| Published in | Journal of Civil, Construction and Environmental Engineering (Volume 10, Issue 2) |
| DOI | 10.11648/j.jccee.20251002.11 |
| Page(s) | 49-59 |
| Creative Commons |
This is an Open Access article, distributed under the terms of the Creative Commons Attribution 4.0 International License (http://creativecommons.org/licenses/by/4.0/), which permits unrestricted use, distribution and reproduction in any medium or format, provided the original work is properly cited. |
| Copyright |
Copyright © The Author(s), 2025. Published by Science Publishing Group |
HEC-GeoHMS, Flashflood, Hazard, Mitigation, Hydrographs
SN | Data | Purpose | Source |
|---|---|---|---|
1 | 10m DEM | Data support for Hydrologic computations & modelling | NASA (https://urs.earthdata.nasa.gov/oauth/authorize?response_type= code&client_id=OLpAZlE4HqIOMr0TYqg7UQ&redirect_uri=https%3A%2F%2Fd53njncz5taqi.cloudfront.net%2Furs_callback&state=https%3A%2F%2Fsearch.earthdata.nasa.gov%2Fdownloads%2F5915390643%3Fee%3Dprod) |
2 | LULC | To estimate manning’s value at each river cross section | Sentinel-2 10m Land Use/Land Cover Time series Downloader (https://www.arcgis.com/apps/instant/media/index.html?appid=fc92d38533d440078f17678ebc20e8e2) |
3 | Drainage Network details | Hydrographic data | Office of Surveyor General of the Federation (OSGOF) |
5 | Discharge, flow | Hydrologic modelling | Ogun-Oshun River Basin Development Authority, O-ORBDA Abeokuta, Ogun State, Nigeria |
7 | Monthly rainfall data | Hydrologic modelling | Ogun-Oshun River Basin Development Authority, O-ORBDA Abeokuta, Ogun State, Nigeria |
8 | Soil | Run off Curve Number determination | Harmonized World Soil Database |
Events | Start date | Start time | End date | End time | Selection |
|---|---|---|---|---|---|
Event 1 | Jun 10th 2022 | 0:00 | Jul 24th 2022 | 0:00 | Calibration |
Event 2 | Aug 25th 2022 | 0:00 | Aug 31st 2022 | 0:00 | Calibration |
Event 3 | Sept 4th 2022 | 0:00 | Sept 11th 2022 | 0:00 | Calibration |
Event 4 | Oct 9th 2022 | 0:00 | Oct 14th 2022 | 0:00 | Calibration |
Event 5 | Jan 24th 2023 | 0:00 | Jan 31st 2023 | 0:00 | Validation |
Event 6 | Apr 4th 2023 | 0:00 | May 19th 2023 | 0:00 | Validation |
CN | Ɩ (Km) | Basin slope | Area (sqkm) | S = (1000/CN)-10 | Y (%) | Tc | Lag (min) | Innitial Abstraction =0.2S | |
|---|---|---|---|---|---|---|---|---|---|
Subbasin-1 | 62 | 6.55294 | 0.01209 | 13.70213 | 6.129032 | 1.209 | 90.62141 | 3262.371 | 1.225806 |
Subbasin-10 | 62 | 5.24796 | 0.00404 | 3.758467 | 6.129032 | 0.404 | 131.2492 | 4724.972 | 1.225806 |
Subbasin-11 | 62 | 3.82998 | 0.00711 | 7.073021 | 6.129032 | 0.711 | 76.89842 | 2768.343 | 1.225806 |
Subbasin-12 | 62 | 6.14985 | 0.00264 | 15.15225 | 6.129032 | 0.264 | 184.3252 | 6635.706 | 1.225806 |
Subbasin-13 | 60 | 6.57634 | 0.00353 | 8.404761 | 6.666667 | 0.353 | 176.9694 | 6370.9 | 1.333333 |
Subbasin-14 | 62 | 7.68589 | 0.008 | 8.819081 | 6.129032 | 0.8 | 126.5626 | 4556.253 | 1.225806 |
Subbasin-15 | 62 | 6.05414 | 0.00351 | 3.610496 | 6.129032 | 0.351 | 157.8641 | 5683.108 | 1.225806 |
Subbasin-16 | 22 | 6.23839 | 0.00676 | 8.227196 | 35.45455 | 0.676 | 365.1611 | 13145.8 | 7.090909 |
Subbasin-18 | 81 | 4.09055 | 0.00916 | 4.468729 | 2.345679 | 0.916 | 42.05234 | 1513.884 | 0.469136 |
Subbasin-19 | 81 | 6.2618 | 0.00496 | 8.404761 | 2.345679 | 0.496 | 80.33987 | 2892.235 | 0.469136 |
Subbasin-2 | 81 | 6.16714 | 0.00685 | 13.82051 | 2.345679 | 0.685 | 67.53585 | 2431.29 | 0.469136 |
Subbasin-20 | 22 | 6.16102 | 0.01098 | 9.144617 | 35.45455 | 1.098 | 283.6748 | 10212.29 | 7.090909 |
Subbasin-21 | 21 | 5.86482 | 0.00767 | 12.72552 | 37.61905 | 0.767 | 339.7354 | 12230.47 | 7.52381 |
Subbasin-22 | 81 | 5.02807 | 0.01153 | 9.914067 | 2.345679 | 1.153 | 44.20984 | 1591.554 | 0.469136 |
Subbasin-23 | 21 | 4.51198 | 0.007 | 5.238179 | 37.61905 | 0.7 | 288.3231 | 10379.63 | 7.52381 |
Subbasin-25 | 81 | 10.14216 | 0.00883 | 14.20523 | 2.345679 | 0.883 | 88.5598 | 3188.153 | 0.469136 |
Subbasin-26 | 81 | 8.01266 | 0.00384 | 17.19425 | 2.345679 | 0.384 | 111.2163 | 4003.786 | 0.469136 |
Subbasin-27 | 21 | 5.2001 | 0.00528 | 10.44676 | 37.61905 | 0.528 | 371.9008 | 13388.43 | 7.52381 |
Subbasin-28 | 22 | 14.96004 | 0.00546 | 26.07252 | 35.45455 | 0.546 | 817.9931 | 29447.75 | 7.090909 |
Subbasin-29 | 81 | 4.20355 | 0.00762 | 7.635311 | 2.345679 | 0.762 | 47.12247 | 1696.409 | 0.469136 |
Subbasin-30 | 21 | 2.88634 | 0.0071 | 3.462525 | 37.61905 | 0.71 | 200.2551 | 7209.182 | 7.52381 |
Subbasin-31 | 62 | 3.61009 | 0.00743 | 5.504527 | 6.129032 | 0.743 | 71.74886 | 2582.959 | 1.225806 |
Subbasin-32 | 62 | 3.82998 | 0.00367 | 6.362759 | 6.129032 | 0.367 | 107.0334 | 3853.201 | 1.225806 |
Subbasin-33 | 22 | 5.3365 | 0.0101 | 6.895456 | 35.45455 | 1.01 | 263.66 | 9491.761 | 7.090909 |
Subbasin-34 | 62 | 3.12963 | 0.00572 | 4.735077 | 6.129032 | 0.572 | 72.9443 | 2625.995 | 1.225806 |
Subbasin-35 | 62 | 3.82386 | 0.01079 | 3.166583 | 6.129032 | 1.079 | 62.34274 | 2244.339 | 1.225806 |
Subbasin-36 | 81 | 3.36681 | 0.0067 | 3.314554 | 2.345679 | 0.67 | 42.07751 | 1514.791 | 0.469136 |
Subbasin-37 | 21 | 3.30777 | 0.00677 | 3.551308 | 37.61905 | 0.677 | 228.7013 | 8233.246 | 7.52381 |
Subbasin-4 | 81 | 4.33995 | 0.01123 | 7.191398 | 2.345679 | 1.123 | 39.82085 | 1433.55 | 0.469136 |
Subbasin-40 | 81 | 5.55639 | 0.007 | 7.132209 | 2.345679 | 0.7 | 61.46073 | 2212.586 | 0.469136 |
Subbasin-42 | 81 | 4.5181 | 0.00958 | 5.859658 | 2.345679 | 0.958 | 44.52403 | 1602.865 | 0.469136 |
Subbasin-43 | 22 | 7.56783 | 0.00695 | 11.71932 | 35.45455 | 0.695 | 420.3243 | 15131.67 | 7.090909 |
Subbasin-45 | 81 | 5.61542 | 0.00768 | 6.451542 | 2.345679 | 0.768 | 59.17493 | 2130.298 | 0.469136 |
Subbasin-49 | 81 | 7.69811 | 0.01034 | 14.82671 | 2.345679 | 1.034 | 65.63865 | 2362.991 | 0.469136 |
Subbasin-5 | 62 | 7.06291 | 0.00363 | 12.34079 | 6.129032 | 0.363 | 175.6017 | 6321.66 | 1.225806 |
Subbasin-50 | 61 | 4.74916 | 0.00674 | 8.108819 | 6.393443 | 0.674 | 96.23428 | 3464.434 | 1.278689 |
Subbasin-54 | 81 | 4.31655 | 0.01141 | 5.59331 | 2.345679 | 1.141 | 39.335 | 1416.06 | 0.469136 |
Subbasin-57 | 62 | 5.68668 | 0.00652 | 5.682092 | 6.129032 | 0.652 | 110.1687 | 3966.073 | 1.225806 |
Subbasin-6 | 21 | 3.30777 | 0.00889 | 3.018611 | 37.61905 | 0.889 | 199.5777 | 7184.798 | 7.52381 |
Subbasin-64 | 62 | 9.69121 | 0.00658 | 12.25201 | 6.129032 | 0.658 | 167.9904 | 6047.654 | 1.225806 |
Subbasin-69 | 81 | 5.52687 | 0.00469 | 5.238179 | 2.345679 | 0.469 | 74.76693 | 2691.61 | 0.469136 |
Subbasin-7 | 22 | 4.66061 | 0.00516 | 4.40954 | 35.45455 | 0.516 | 331.0009 | 11916.03 | 7.090909 |
Subbasin-71 | 62 | 4.85604 | 0.00452 | 4.113598 | 6.129032 | 0.452 | 116.6142 | 4198.113 | 1.225806 |
Subbasin-8 | 81 | 4.37558 | 0.0069 | 6.777079 | 2.345679 | 0.69 | 51.1348 | 1840.853 | 0.469136 |
Subbasin-9 | 61 | 8.78932 | 0.00867 | 16.27683 | 6.393443 | 0.867 | 138.842 | 4998.313 | 1.278689 |
Events | Observed | Peak Discharge (m3/s) | Total Volume (mm) | R² | ||||||
|---|---|---|---|---|---|---|---|---|---|---|
Simulated | Simulated | |||||||||
Bopt | Aopt | REp | Observed | Bopt | Aopt | REv | NSE | |||
Event 1 | 18.37 | 31.8 | 19.6 | -0.067 | 315.83 | 362.83 | 337.02 | -0.067 | 0.958 | 0.741 |
Event 2 | 114.68 | 345.2 | 122.7 | -0.070 | 156.13 | 142.01 | 166.3 | -0.065 | 0.968 | 0.940 |
Event 3 | 230.21 | 205.8 | 248.6 | -0.080 | 150.85 | 142.31 | 176.43 | -0.170 | 0.829 | 0.623 |
Event 4 | 18.70 | 211.9 | 17.2 | 0.080 | 332.64 | 253.31 | 355.12 | -0.068 | 0.965 | 0.709 |
Mean | 95.49 | 198.68 | 102.03 | 0.03 | 226.188 | 218.02 | 243.034 | 0.079 | 0.940 | 0.800 |
Events | Observed | Peak Discharge (m3/s) | Total Volume (mm) | R² | ||||||
|---|---|---|---|---|---|---|---|---|---|---|
Simulated | Simulated | |||||||||
Bopt | Aopt | REp | Observed | Bopt | Aopt | REv | NSE | |||
Event 5 | 166.92 | 227.2 | 157.1 | 0.060 | 175.49 | 189.93 | 180.3 | -0.027 | 0.983 | 0.987 |
Event 6 | 71.05 | 49.2 | 75.1 | -0.060 | 144.79 | 178.08 | 145.45 | -0.005 | 0.999 | 0.999 |
Mean | 118.98 | 138.2 | 116.1 | 0.001 | 160.14 | 184.001 | 162.88 | -0.016 | 0.992 | 0.993 |
Hydrologic Elements | Area_sqkm | Peak Discharge (m3/s) | Loss Volume (mm) | Excess Volume (mm) | Direct Runoff Volume (mm) | Town |
|---|---|---|---|---|---|---|
Subbasin-4, 18 & 22 | 21.57419379 | 4.5 | 144.96 | 585.52 | 585.38 | Ilobi/Erinja |
Subbasin-2, 12 & 36 | 32.2873051 | 3.9 | 192.64 | 537.74 | 531.71 | Igbobe |
Subbasin-1, 6, 16, 20, 28, 33 & 50 | 75.16934461 | 3.1 | 1170.93 | 533.29 | 486.30 | Ilaro |
Subbasin-26, 32 & 71 | 27.6706052 | 3 | 240.32 | 490.06 | 485.56 | Idogo/Ipaja |
Subbasin-29 42 | 13.49496895 | 2.7 | 96.64 | 390.38 | 390.23 | Okuta |
Subbasin-19 & 25 | 22.60999184 | 3.3 | 96.64 | 390.38 | 389.05 | Erimi-Oguntade |
Subbasin-8, 27 & 34 | 21.95891878 | 2.1 | 341.06 | 389.32 | 380.44 | Ajelete |
Subbasin-31 & 57 | 11.186619 | 1.2 | 192 | 294.92 | 293.27 | Erimi-Ebute |
Subbasin-5, 30, 37, 43 | 31.07394167 | 1.2 | 683.8 | 290.04 | 267.68 | Owode |
Subbasin-23 & 45 | 11.68972091 | 1.2 | 245.06 | 241.86 | 235.92 | Ajilete |
Subbasin-54 | 5.5933095 | 1.2 | 48.32 | 195.24 | 195.13 | Oju-Ota |
Subbasin-40 | 7.132209469 | 1.1 | 48.32 | 195.14 | 194.99 | Iwoye |
Subbasin-49 | 14.82670931 | 2.4 | 48.32 | 195.24 | 194.93 | Alagbe |
Subbasin-69 | 5.238178738 | 0.8 | 48.32 | 195.14 | 194.76 | Araromi |
Subbasin-14 & 21 | 21.54459956 | 1 | 292.74 | 194.18 | 184.57 | Oke-Odan |
Subbasin-35 | 3.166582627 | 0.4 | 96 | 147.46 | 147.32 | Oke-Erinja |
Subbasin-11 | 7.073021008 | 0.9 | 96 | 147.46 | 147.09 | Ipake |
Subbasin-10 | 3.75846723 | 0.3 | 96 | 147.46 | 145.1 | Irogun-Akere |
Subbasin-15 | 3.61049608 | 0.3 | 96 | 147.46 | 143.53 | Ayekoshe |
Subbasin-64 | 12.25201129 | 0.9 | 96 | 147.46 | 142.86 | Ipaja |
Subbasin-9 | 16.27682659 | 1.3 | 98.49 | 144.97 | 142.22 | Elemuren |
Subbasin-13 | 8.404761366 | 0.6 | 100 | 142.48 | 137.34 | Kakanfo |
Subbasin-7 | 4.409540294 | 0.1 | 194.32 | 49.14 | 41.6 | Iweke |
Class | Susceptibility Threshold |
|---|---|
500-600 | Extremely High |
400-500 | Very High |
300-400 | High |
200-300 | Medium |
100-200 | Low |
0-100 | Very low |
O-ORBDA | Ogun-Osun River Basin Development Authority |
NASA | National Aeronautics and Space Administration |
OSGOF | Office of Surveyor General of the Federation |
LULC | Land use Land Cover |
DEM | Digital Elevation Model |
HEC-HMS | Hydrological Engineering Center Hydrological Modelling Systems |
HEC-RAS | Hydrological Engineering Center River Analysis Systems |
HEC-GeoHMS | Hydrological Engineering Center Geospatial Hydrological Modelling Systems |
ESRI | Environmental System Research Institute |
GIS | Geographical Information Systems |
CN | Curve Number |
SCS | Soil Conservation Service |
NDVI | Normalized Difference Vegetative Index |
TWI | Topographic Wetness Index |
SMCDA | Spatial Multi-Criteria Decision Analysis |
SDG | Sustainable Development Goal |
| [1] | Ye, K., Liang, Z., Chen, H., Qian, M., Hu, Y., Bi, C.,... Li, B. (2024). Regionalization Strategy Guided Long Short-Term Memory Model for Improving Flood Forecasting. Journal of Hydrologocal Processes |
| [2] | Hadi, H. M., Andam, M. M., & Tomasz, K. (2020). Hydrological responses to large-scale changes. Journal of Water and Land Development, 108-121. |
| [3] | Ware, H. H., Chang, W. S., Lee, E. J., & Chung, M. I. (2024). Assessment of Hydrological Responses to Land Use and Land Cover Changes in Forest-Dominated Watershed Using SWAT Model. Journal of Water, 528. |
| [4] | Ayalew, D. A., Wagner, D. P., Tigabu, B. T., Sahlu, D., & Fohre, N. (2023). Hydrological responses to land use and land cover change and climate dynamics in the Rift Valley Lakes Basin, Ethiopia. Journal of Water and Climate Change, 1-10. |
| [5] | Sherif, A. A., Ahmed, M. M., Ahmed, A. M., & Bakr, M. B. (2022). Current Directions in Water Scarcity Research. In Flash floods and their impact on natural life using surface water model and GIS technique at Wadi Degla natural reserve area, Egypt (pp. 621-640). Cairo: Elsevier. |
| [6] |
Kuksina, L., & Golosov, V. (2020). Flash floods: Formation, Study and Distribution. Vinogradov Conference IV:
https://doi.org/10.1051/e3sconf/202016302005 (p. 2). Moscow: E3S Web of Conference. |
| [7] |
Raheem, L. (2021, June 29). The Sun. Retrieved from Flood alert: Ogun to experience flash floods between July 8, 15:
https://www.sunnewsonline.com/flood-alert-ogun-to-experience-flash-floods-between-july-8-15/ |
| [8] | Fasua, K. (2020, July 7). Residents Lament Ordeal, Seek Solution to Abeokuta Flooding. Retrieved from ThisDay: |
| [9] |
Olukoya, O. (2018, July 17). Nigerian Tribune. Retrieved from Abeokuta Flood Of Fury: It’s Lamentation, Losses For Residents:
https://tribuneonlineng.com/abeokuta-flood-of-fury-its-lamentation-losses-for-residents/ |
| [10] |
Igomu, T. (2016, November 17). The Sun. Retrieved from Again, flood wreaks havoc on Lagos, Ogun communities:
https://www.sunnewsonline.com/again-flood-wreaks-havoc-on-lagos-ogun-communities/ |
| [11] | Ghoneim, S. A., Elsayed, M. M., & Amer, H. S. (2022). A GIS vulnerability assessment tool to support strategic planning of cities facing flash floods - case study of Nuweiba City -Egypt.. Journal of Civil Engineering and Architecture, 288–312. |
| [12] | Olayinka, D. N., & Irivbogbe, H. E. (2017). Flood Modelling and Risk Assessment of Lagos Island and Part Of Eti-Osa Local Government Areas in Lagos State. Journal of Civil and Environmental Systems Engineering,, 106-121. |
| [13] | Adewara, M. B., & Olapeju, O. O. (2022). September 2022 Flood Hazard Mapping of Kogi State. Conference of Environmental Health Science (pp. 1-10). Ilaro: Faculty of Public Health, College of Medicine, University of Ibadan, Nigeria. |
| [14] | Hassan, B. T., Yassine, M., & Amin, D. (2022). Comparison of urbanization, climate change, and drainage design impacts on urban flashfloods in an arid region: Case study, New Cairo, Egypt. Journal of Water, 2430. |
| [15] | Abbott, M. B., Bathurst, J. C., Cunge, J. A., O'Connell, P. E., & Rasmussen, J. (2000). An introduction to the European Hydrological System. Journal of Hydrology, 61-77. |
| [16] | Obiora-Okeke, O. A., Adewumi, J. R., & Ojo, O. M. (2021). Impact of Climate Change on Runoff Prediction in Ogbese River Watershed. FUOYE Journal of Engineering and Technology, 392-396. |
| [17] | Hawkins, R. H., Ward, T. J., Woodward, D. E., & Van Mullem, J. A. (2009). Curve number hydrology: State of the practice. In Environmental and Water Resources Institute (pp. Hawkins, R. H., Ward, T. J., Woodward, D. E., Van Mullem, J. A.,). Reston, VA, USA,: American Society of Civil Engineers. |
| [18] | Schmidt, L., Forkel, M., Maria Zotta, R., Scherrer, S., Dorigo, A. W., Kuhn-Régnier, A.,... Yebra, M. (2023). Assessing the sensitivity of multi-frequency passive microwave vegetation optical depth to vegetation properties. Journal of Biogeosciences, 1027–1046. |
| [19] | Moriasi, D. N., Arnold, J. G., Van Liew, M., Bingner, R. L., Harmel, R. D., & Veith, T. L. (2007). Model evaluation guidelines for systematic quantification of accuracy in watershed simulations. T. ASABE. |
| [20] | Gupta, A., Thakur, P. K., Nikam, B. R., & Chouksey, A. (2014). Hydrological Modelling of Upper and middle Narmada River Basin, India, Using Geospatial Tools. In H. L. Tiwari, S. Suresh, & R. K. Jaiswal, Hydraulics, Water Resources, Coastal and Environmental Engineering (pp. 663-675). New Delhi: Excellent Publishing House. |
| [21] | Manisha, B., Asit, K. D., & Bandita, N. (2021). Hydrological modeling with respect to impact of land-use and land-cover change on the runoff dynamics in Budhabalanga river basing using ArcGIS and SWAT model. Remote Sensing Applications: Society and Environment, 5. |
| [22] | Ogato, G. S., Bantider, A., Abebe, K., & Geneletti, D. (2020). GIS-Based Multicriteria Analysis of Flooding Hazard and Risk in Ambo Town and its Watershed, West shoa zone, oromia regional State, Ethiopia. Journal of Hydrology and Regional Studies. ydrol Reg Stud. |
| [23] | Tadesse, D., Suryabhagavan, V. K., Nedaw, D., & Hailu, T. B. (2022). A model-based flood hazard mapping in Itang District of the Gambella region, Ethiopia. Journal of Geology, Ecolology Landscape. |
| [24] | Wu, Y., Yin, X., Zhou, G., Bruijnzeel, A. L., Dai, A., Wang, F.,... Zhou, D. (2024). Rising Rainfall Intensity induces Spatially Divergent Hydrological Changes within a Large River Basin. Nature Commmunication. |
APA Style
Adedokun, A., Adewara, M., Adaradohun, O. (2025). Flashflood Hazard Assessment in Yewa South Lga. Journal of Civil, Construction and Environmental Engineering, 10(2), 49-59. https://doi.org/10.11648/j.jccee.20251002.11
ACS Style
Adedokun, A.; Adewara, M.; Adaradohun, O. Flashflood Hazard Assessment in Yewa South Lga. J. Civ. Constr. Environ. Eng. 2025, 10(2), 49-59. doi: 10.11648/j.jccee.20251002.11
@article{10.11648/j.jccee.20251002.11,
  author = {Adebayo Adedokun and Monsur Adewara and Oluwayemisi Adaradohun},
  title = {Flashflood Hazard Assessment in Yewa South Lga
},
  journal = {Journal of Civil, Construction and Environmental Engineering},
  volume = {10},
  number = {2},
  pages = {49-59},
  doi = {10.11648/j.jccee.20251002.11},
  url = {https://doi.org/10.11648/j.jccee.20251002.11},
  eprint = {https://article.sciencepublishinggroup.com/pdf/10.11648.j.jccee.20251002.11},
  abstract = {In the bid to accomplish the Sustainable Development Goals, several attempts have been made in Yewa South LGA to accomplish environmental sustainability (SDG7) and reduce the adverse effects of climate change (SDG13). The area has witnessed recurrent flash floods with deleterious effect to lives and properties due to anthropogenic factors coupled with incessant torrential rainfall events which are the major drivers of flood vulnerability in the area. Previous studies have adopted the use of GIS, Remote sensing or an integration both techniques with associated challenges. This study adopts the use of Hydrologic Engineering Centre’s Hydrologic Modelling System with Geographic Information Systems (HEC-GeoHMS) to evaluate the relationship between rainfalls, terrain characteristics, run off and stream flow as an alternative flood mitigation scheme. The catchment area was divided into forty-five sub basins over a 10m DEM, the run off hydrographs simulated and the hydrological characteristics modelled by using rainfall data between 1st June, 2022 – 31st May, 2023 as well as discharge data from Ogun-Osun River basin Development Authority (O-ORBDA). the model parameters were optimized for calibration and the calibrated model was thereafter validated using three statistical evaluation criteria which showed that there is a good simulation between the observed and estimated values (Rep = -2.24%, REv = 6.67%, NSE = 95.03%, and R2 = 0.83). Further analysis of the results showed that the flash flood is induced mainly by hydrologic characteristics of the area. This work therefore proposes to mitigate flood in Yewa South Local Government Area of Ogun State by modelling how excess water runs on the terrain thereby creating flash floods. The model will serve as an input for putting mitigation measures in place to arrest flash floods.
},
 year = {2025}
}
TY  - JOUR
T1  - Flashflood Hazard Assessment in Yewa South Lga

AU  - Adebayo Adedokun
AU  - Monsur Adewara
AU  - Oluwayemisi Adaradohun
Y1  - 2025/03/07
PY  - 2025
N1  - https://doi.org/10.11648/j.jccee.20251002.11
DO  - 10.11648/j.jccee.20251002.11
T2  - Journal of Civil, Construction and Environmental Engineering
JF  - Journal of Civil, Construction and Environmental Engineering
JO  - Journal of Civil, Construction and Environmental Engineering
SP  - 49
EP  - 59
PB  - Science Publishing Group
SN  - 2637-3890
UR  - https://doi.org/10.11648/j.jccee.20251002.11
AB  - In the bid to accomplish the Sustainable Development Goals, several attempts have been made in Yewa South LGA to accomplish environmental sustainability (SDG7) and reduce the adverse effects of climate change (SDG13). The area has witnessed recurrent flash floods with deleterious effect to lives and properties due to anthropogenic factors coupled with incessant torrential rainfall events which are the major drivers of flood vulnerability in the area. Previous studies have adopted the use of GIS, Remote sensing or an integration both techniques with associated challenges. This study adopts the use of Hydrologic Engineering Centre’s Hydrologic Modelling System with Geographic Information Systems (HEC-GeoHMS) to evaluate the relationship between rainfalls, terrain characteristics, run off and stream flow as an alternative flood mitigation scheme. The catchment area was divided into forty-five sub basins over a 10m DEM, the run off hydrographs simulated and the hydrological characteristics modelled by using rainfall data between 1st June, 2022 – 31st May, 2023 as well as discharge data from Ogun-Osun River basin Development Authority (O-ORBDA). the model parameters were optimized for calibration and the calibrated model was thereafter validated using three statistical evaluation criteria which showed that there is a good simulation between the observed and estimated values (Rep = -2.24%, REv = 6.67%, NSE = 95.03%, and R2 = 0.83). Further analysis of the results showed that the flash flood is induced mainly by hydrologic characteristics of the area. This work therefore proposes to mitigate flood in Yewa South Local Government Area of Ogun State by modelling how excess water runs on the terrain thereby creating flash floods. The model will serve as an input for putting mitigation measures in place to arrest flash floods.

VL  - 10
IS  - 2
ER  -
Surveying and Geoinformatics Department, Federal Polytechnic Ilaro, Ilaro, Nigeria
Surveying and Geoinformatics Department, Federal Polytechnic Ilaro, Ilaro, Nigeria
Surveying and Geoinformatics Department, Federal Polytechnic Ilaro, Ilaro, Nigeria